Coronary heart disease (CHD) remains a major health problem and a leading cause of death worldwide.1 The number continues to rise in low- and middle-income countries, including Indonesia, which has the fourth largest population worldwide and is the most populated country in Southeast Asia.2–3 Premature deaths from cardiovascular disease (CVD), including CHD and stroke, are among the highest in the region.4 The increase in CVD incidence and risk factors in developing countries such as Indonesia is the result of demographic changes, the epidemiological transition, urbanisation, lifestyle changes, increasing life expectancy and the high prevalence of CVD risk factors.4–7
The 2021 European Society of Cardiology (ESC) prevention in clinical practice and the 2013 American College of Cardiology/American Heart Association guideline on the assessment of cardiovascular risk, suggest the use of risk-stratification or risk-prediction tools to identify individuals at the highest risk for cardiovascular events and mortality.8–10 Estimation of residual 10-year cardiovascular risk is recommended for two main purposes: to help physicians in their decision-making processes and to inform patients about their individual risk of developing a cardiovascular outcome.
Patients at the highest risk of subsequent CVD events are expected to gain the most benefit from preventive treatments such as medication to lower cholesterol and blood pressure. High-risk patients experience a larger absolute risk reduction (ARR) and subsequently have a lower number needed to treat (NNT) for any type of preventive treatment.11,12 In addition, available prediction algorithms for individual risk estimations for recurrent cardiovascular events can be used to provide patients with knowledge regarding their disease prognosis, potentially increasing their awareness and positively impacting their behaviour toward preventive interventions.13
In contrast to the wide availability of CVD risk scores for primary prevention, tools or algorithms for predicting risk in the secondary prevention population are limited, particularly in the Asian region.8,14 The Secondary Manifestations of ARTerial disease (SMART) 2 risk algorithm is a novel tool to estimate the future risk for fatal and non-fatal cardiovascular events.15 The SMART2 risk score can be used to estimate the risk of 10-year recurrent fatal and non-fatal cardiovascular events among adults with manifested CVD and has been validated and calibrated for many regions including Asia.15 As the evidence on current risk-factor control and risk of recurrent CVD events in low- and middle-income countries is very scarce, the aim of the current study is to apply the SMART2 risk algorithm and describe the distribution of the 10-year risk of recurrent cardiovascular events among Indonesian adults with established CHD, and to estimate the residual risk if patients were to achieve the guideline-recommended risk-factor targets.
Methods
Study Design
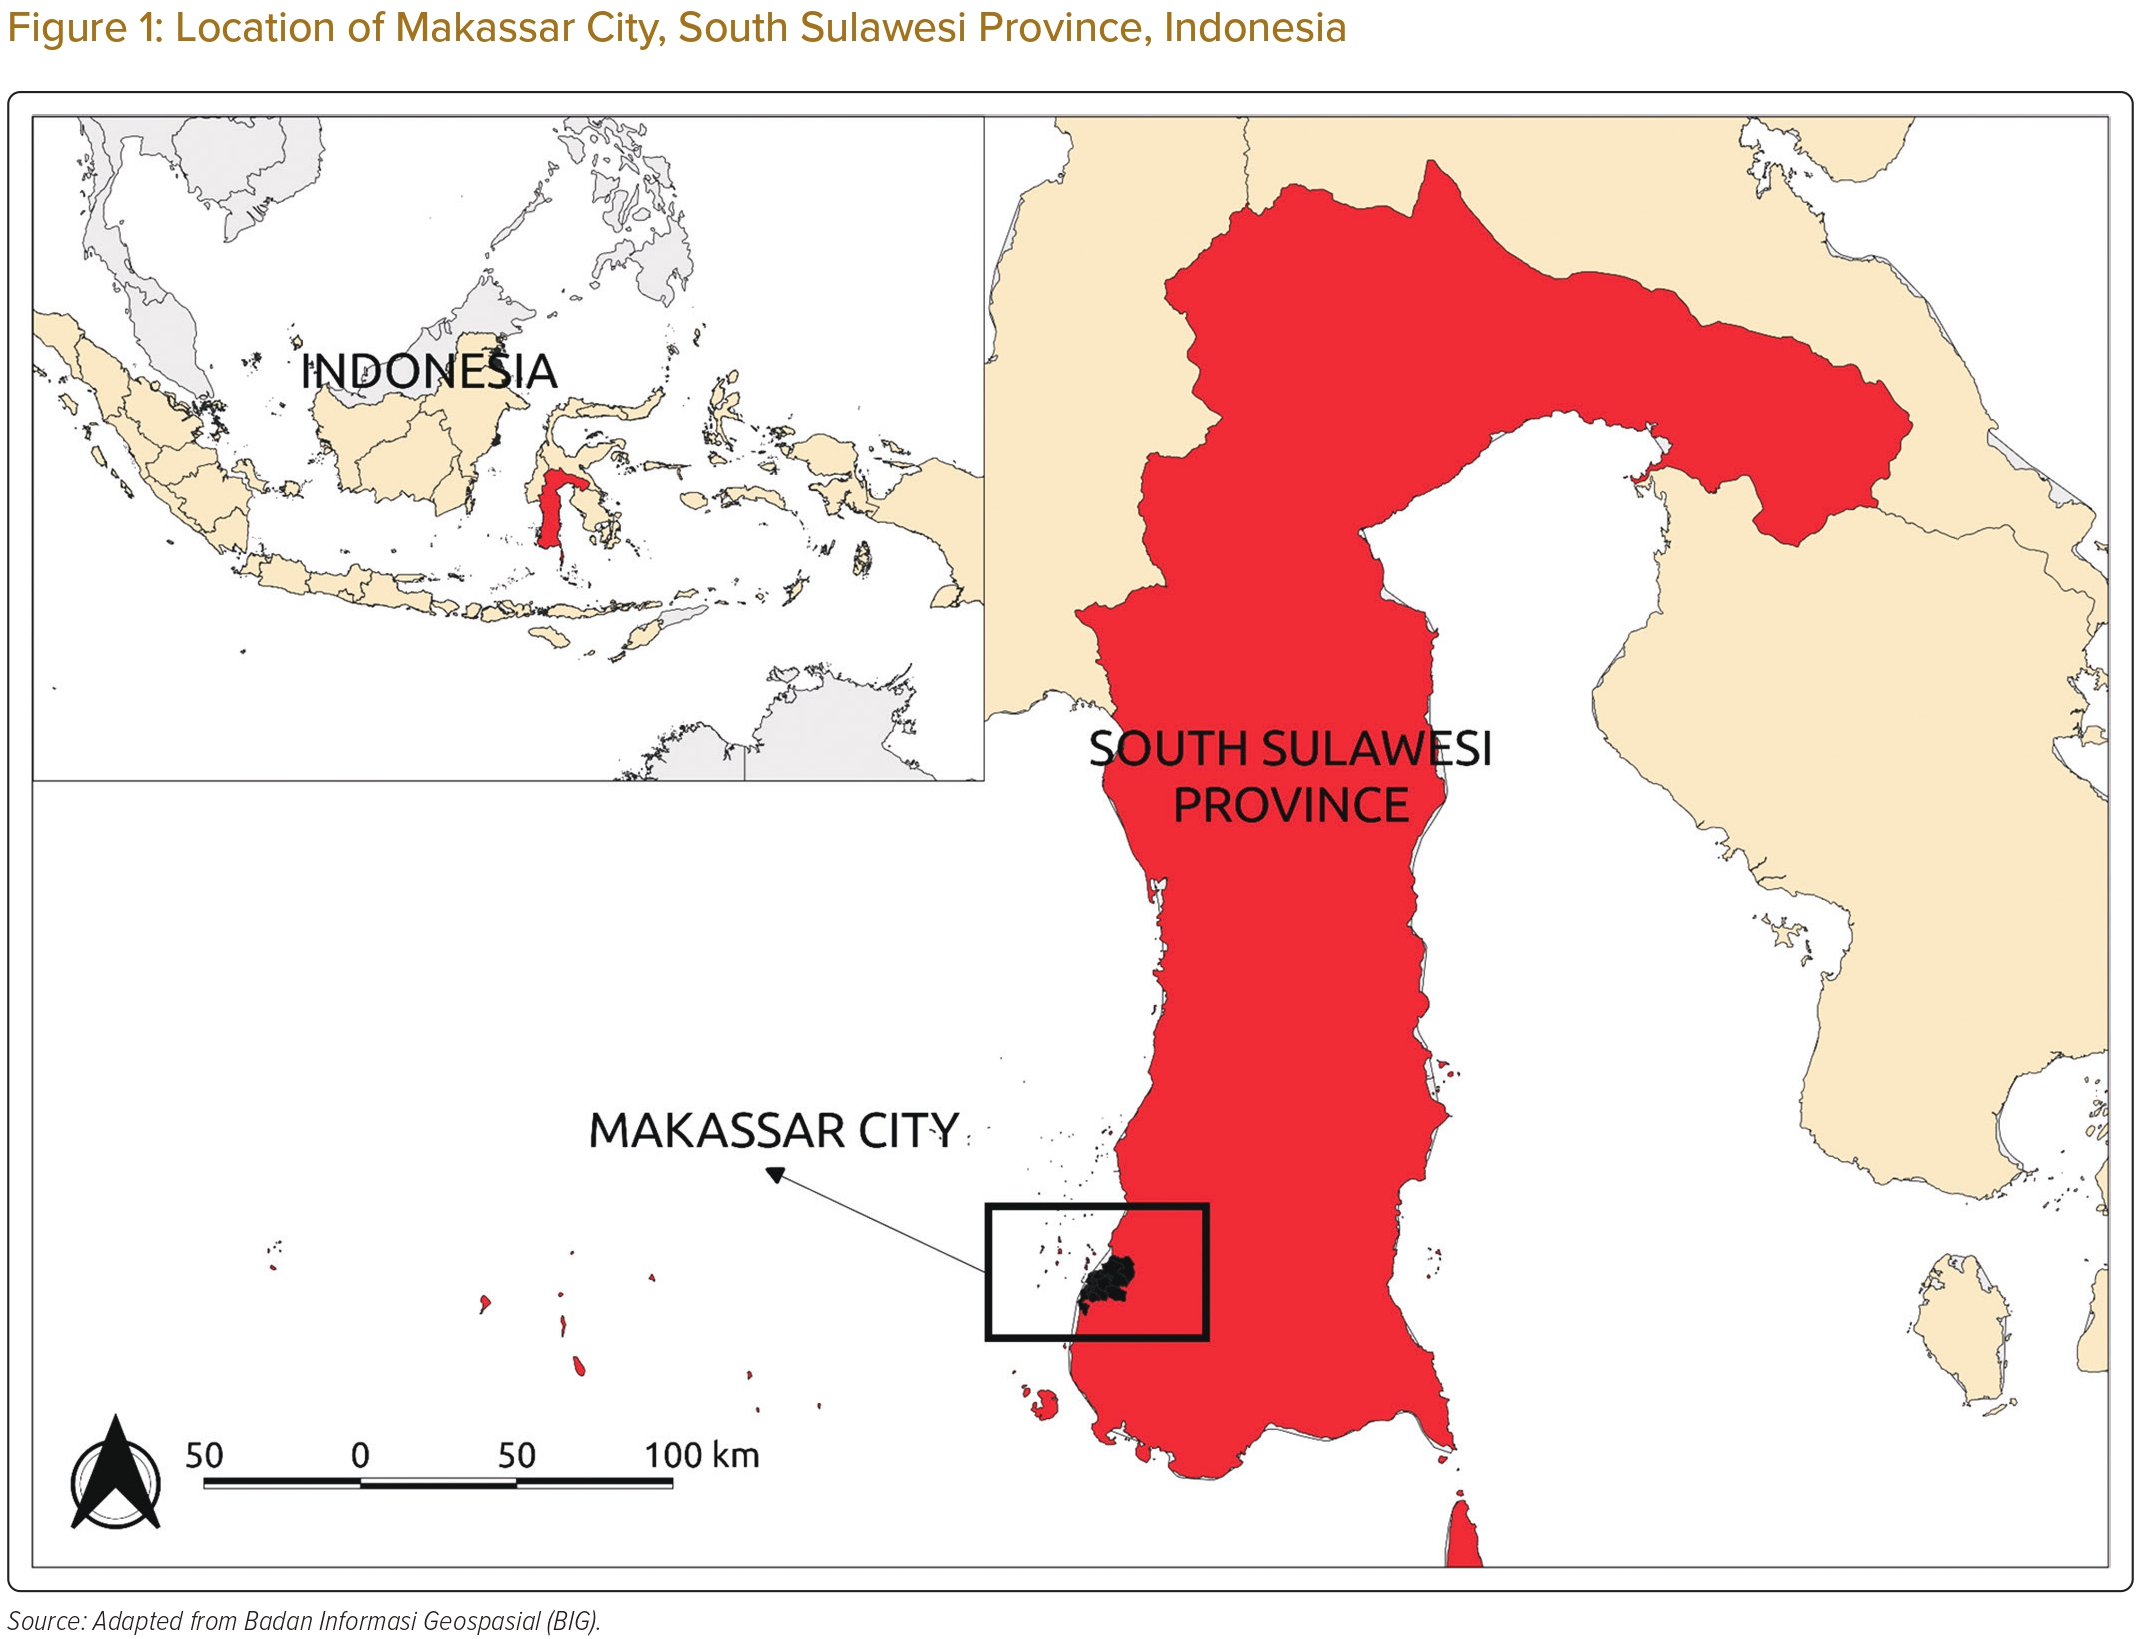
The cross-sectional study was conducted at Makassar Cardiac Center (MCC), Wahidin Sudirohusodo Hospital, Makassar, Indonesia. Makassar is the largest city located in the eastern part of Indonesia and the fifth most populated city in the country, with 1.5 million people residing in the area (Figure 1).16 Furthermore, MCC is the largest cardiac referral unit for the eastern region of Indonesia, mainly serving the 9.5 million people of South Sulawesi and neighbouring areas. More than 22,400 outpatient and more than 3,300 inpatient visits to MCC were recorded in 2018.17
Participants
The study population comprised patients with established CHD, defined as a documented history of stable angina, unstable angina, percutaneous coronary intervention, coronary artery bypass graft surgery or MI. A consecutive sampling technique was performed by approaching patients who visited the MCC outpatient clinic to participate in our study.
We used the formula: n = Z2 * p * (1-p))/d2 to estimate a single proportion in the population.18 Assuming that 50% of the participants in the population have a high recurrent risk for CVD events (p), with 5% absolute precision (d), and 95% confidence level (Z=1.96), the study would require a minimum sample size of 385 CHD patients. To anticipate non-response, we added 10% to the minimum sample size, resulting in a target sample size of 423 participants. During the data collection phase, we approached 420 patients, of whom 395 agreed to participate. Adult participants (aged >30 years) with a documented CHD diagnosis, who were scheduled for a medical check-up and treatment at the MCC and who were able to communicate fluently in Bahasa were eligible for inclusion. Patients who refused to participate in the study were excluded from analysis.
Variables and Measurements
Data were collected in an objective manner using a self-administered questionnaire for socio-demographic information, along with extraction of medical records for clinical laboratory test results to ensure standardised and consistent data collection. Patient characteristics included socio-demographic parameters (age, sex, marital status, educational level, employment status), physical examination (blood pressure, height, weight and waist circumference) and medical history (family aged <55 years with a CVD diagnosis or event, history of hypertension and diabetes, smoking status and age at first CVD event). Plasma glucose, lipid profiles (total cholesterol, HDL cholesterol, LDL cholesterol and triglycerides), and renal function (creatinine) were measured within 24 hours of hospital admission following a minimum 8-hour fast in all participants. All blood samples were analysed in the hospital laboratory using standardised methods.
Ten-year Risk of Recurrent Fatal and Non-fatal Cardiovascular Disease Events
The definition for developing fatal or non-fatal CVD events in the derivation of SMART2 risk prediction model includes non-fatal MI, non-fatal stroke or cardiovascular mortality. Detailed information on the fatal and non-fatal CVD definition used is available in the original SMART2 study.15 Data extracted from the medical records included blood profiles (systolic blood pressure [SBP] and diastolic blood pressure, total cholesterol, HDL cholesterol, LDL cholesterol, creatinine, fasting plasma glucose [FPG] and triglycerides). Age, sex, smoking status, SBP, diabetes status, total cholesterol, HDL cholesterol, LDL cholesterol, creatinine and high-sensitivity C-reactive protein (hs-CRP) were used to predict the 10-year risk of recurrent fatal and non-fatal CVD events using the SMART2 risk score algorithm. An estimated score of <10% was classified as low risk, 10% to <20% as moderate risk, 20% to <30% as high risk, 30% to <50% as very high risk and ≥50% as extremely high risk. External validation of the SMART2 risk score for the prediction of recurrent atherosclerotic CVD in different populations showed adequate calibration and discrimination (C-statistic ranged from 0.605 to 0.772).15 An online version of the SMART2 risk score calculator is available at https://u-prevent.com/calculators/.
Estimating the Residual Risk after Optimisation of Risk-factor Control
Achieving SBP ≤140 mmHg, LDL cholesterol ≤1.8 mmol/l, smoking cessation and use of antithrombotic agents as recommended by the Indonesian guidelines for CVD patients were defined as the optimisation of risk-factor control.19–21 These selected risk-factor targets are in line with those described in the 2021 ESC CVD prevention guidelines and are the cornerstones of secondary prevention in CHD patients.9 Residual risk in the current study was defined as the risk of recurrent fatal and non-fatal CVD events that persists despite the optimisation of risk-factor control.
The relative risk for treating risk factors to the recommended level was obtained from meta-analyses, and combined with the competing risk-adjusted Cox proportional hazard function from the SMART2 model according to previously described methods to calculate residual risk.22–26 HR 0.80 (95% CI [0.77–0.83]) was assumed per 10 mmHg reduction in SBP, 0.77 (95% CI [0.75–0.79]) per 1.0 mmol/l reduction in LDL cholesterol, 0.60 (95% CI [0.49–0.88]) for smoking cessation, and 0.81 (95% CI [0.73–0.88]) for antithrombotic use (aspirin or equivalent).22–23,25,27 Patients who had already achieved an individual target for a particular risk factor were modelled with a HR of 1.00 for that target. ARR was defined as the difference from the baseline 10-year risk of recurrent fatal and non-fatal CVD event with the residual risk after modifying the risk factors (SBP, LDL cholesterol, smoking cessation and antithrombotic use) according to the current Indonesian CVD prevention guideline.19 The NNT based on the patient characteristics was calculated using formula NNT=1/ARR.
Data Analyses
Categorical data are presented as frequency and percentage, while all continuous variables are presented as a median and interquartile range (IQR) because of a prior normality test that showed skewed distribution (p-value <0.05 using the Shapiro–Wilk and Kolmogorov–Smirnov test). The X2 test was used to compare the difference in proportion between categorical variables. In addition, the non-parametric Kruskal–Wallis test was used to compare continuous variables across the 10-year risk categories, namely low to moderate risk (<20%), high risk (20% to <30%), very high risk (30% to <50%), and extremely high risk (≥50%). A p-value <0.05 (two-tailed) was considered statistically significant. The estimated 10-year risk distributions between the current risk-factor condition (baseline) and if the risk factors were controlled as recommended by the guideline (residual risk) were plotted in histograms and density plots. As data for hs-CRP were not available, the median value hs-CRP from the derivation cohort as reported previously was imputed.28 We calculated the 10-year risk for recurrent CVD events and residual risk using R statistical software, version 3.5.2 (R Foundation for Statistical Computing). Univariate analysis was performed using Statistical Package for Social Science version 26 (IBM Corp, Armonk, NY, US).
Ethical Approval
The study objectives were explained to participants, along with assurance of the confidentiality of the information provided and protection of their privacy rights, mandated by the research ethics guidelines of the human research ethics committees. After the explanation, 395 (94%) patients agreed to participate. Ethical approval was obtained from the Ethical Review Board at Public Health Faculty, Hasanuddin University, Makassar, Indonesia (document number 8361/UN4.14.1/TP.02.02/2020). All participants provided written, dated and signed informed consent.
Results
Participant Characteristics
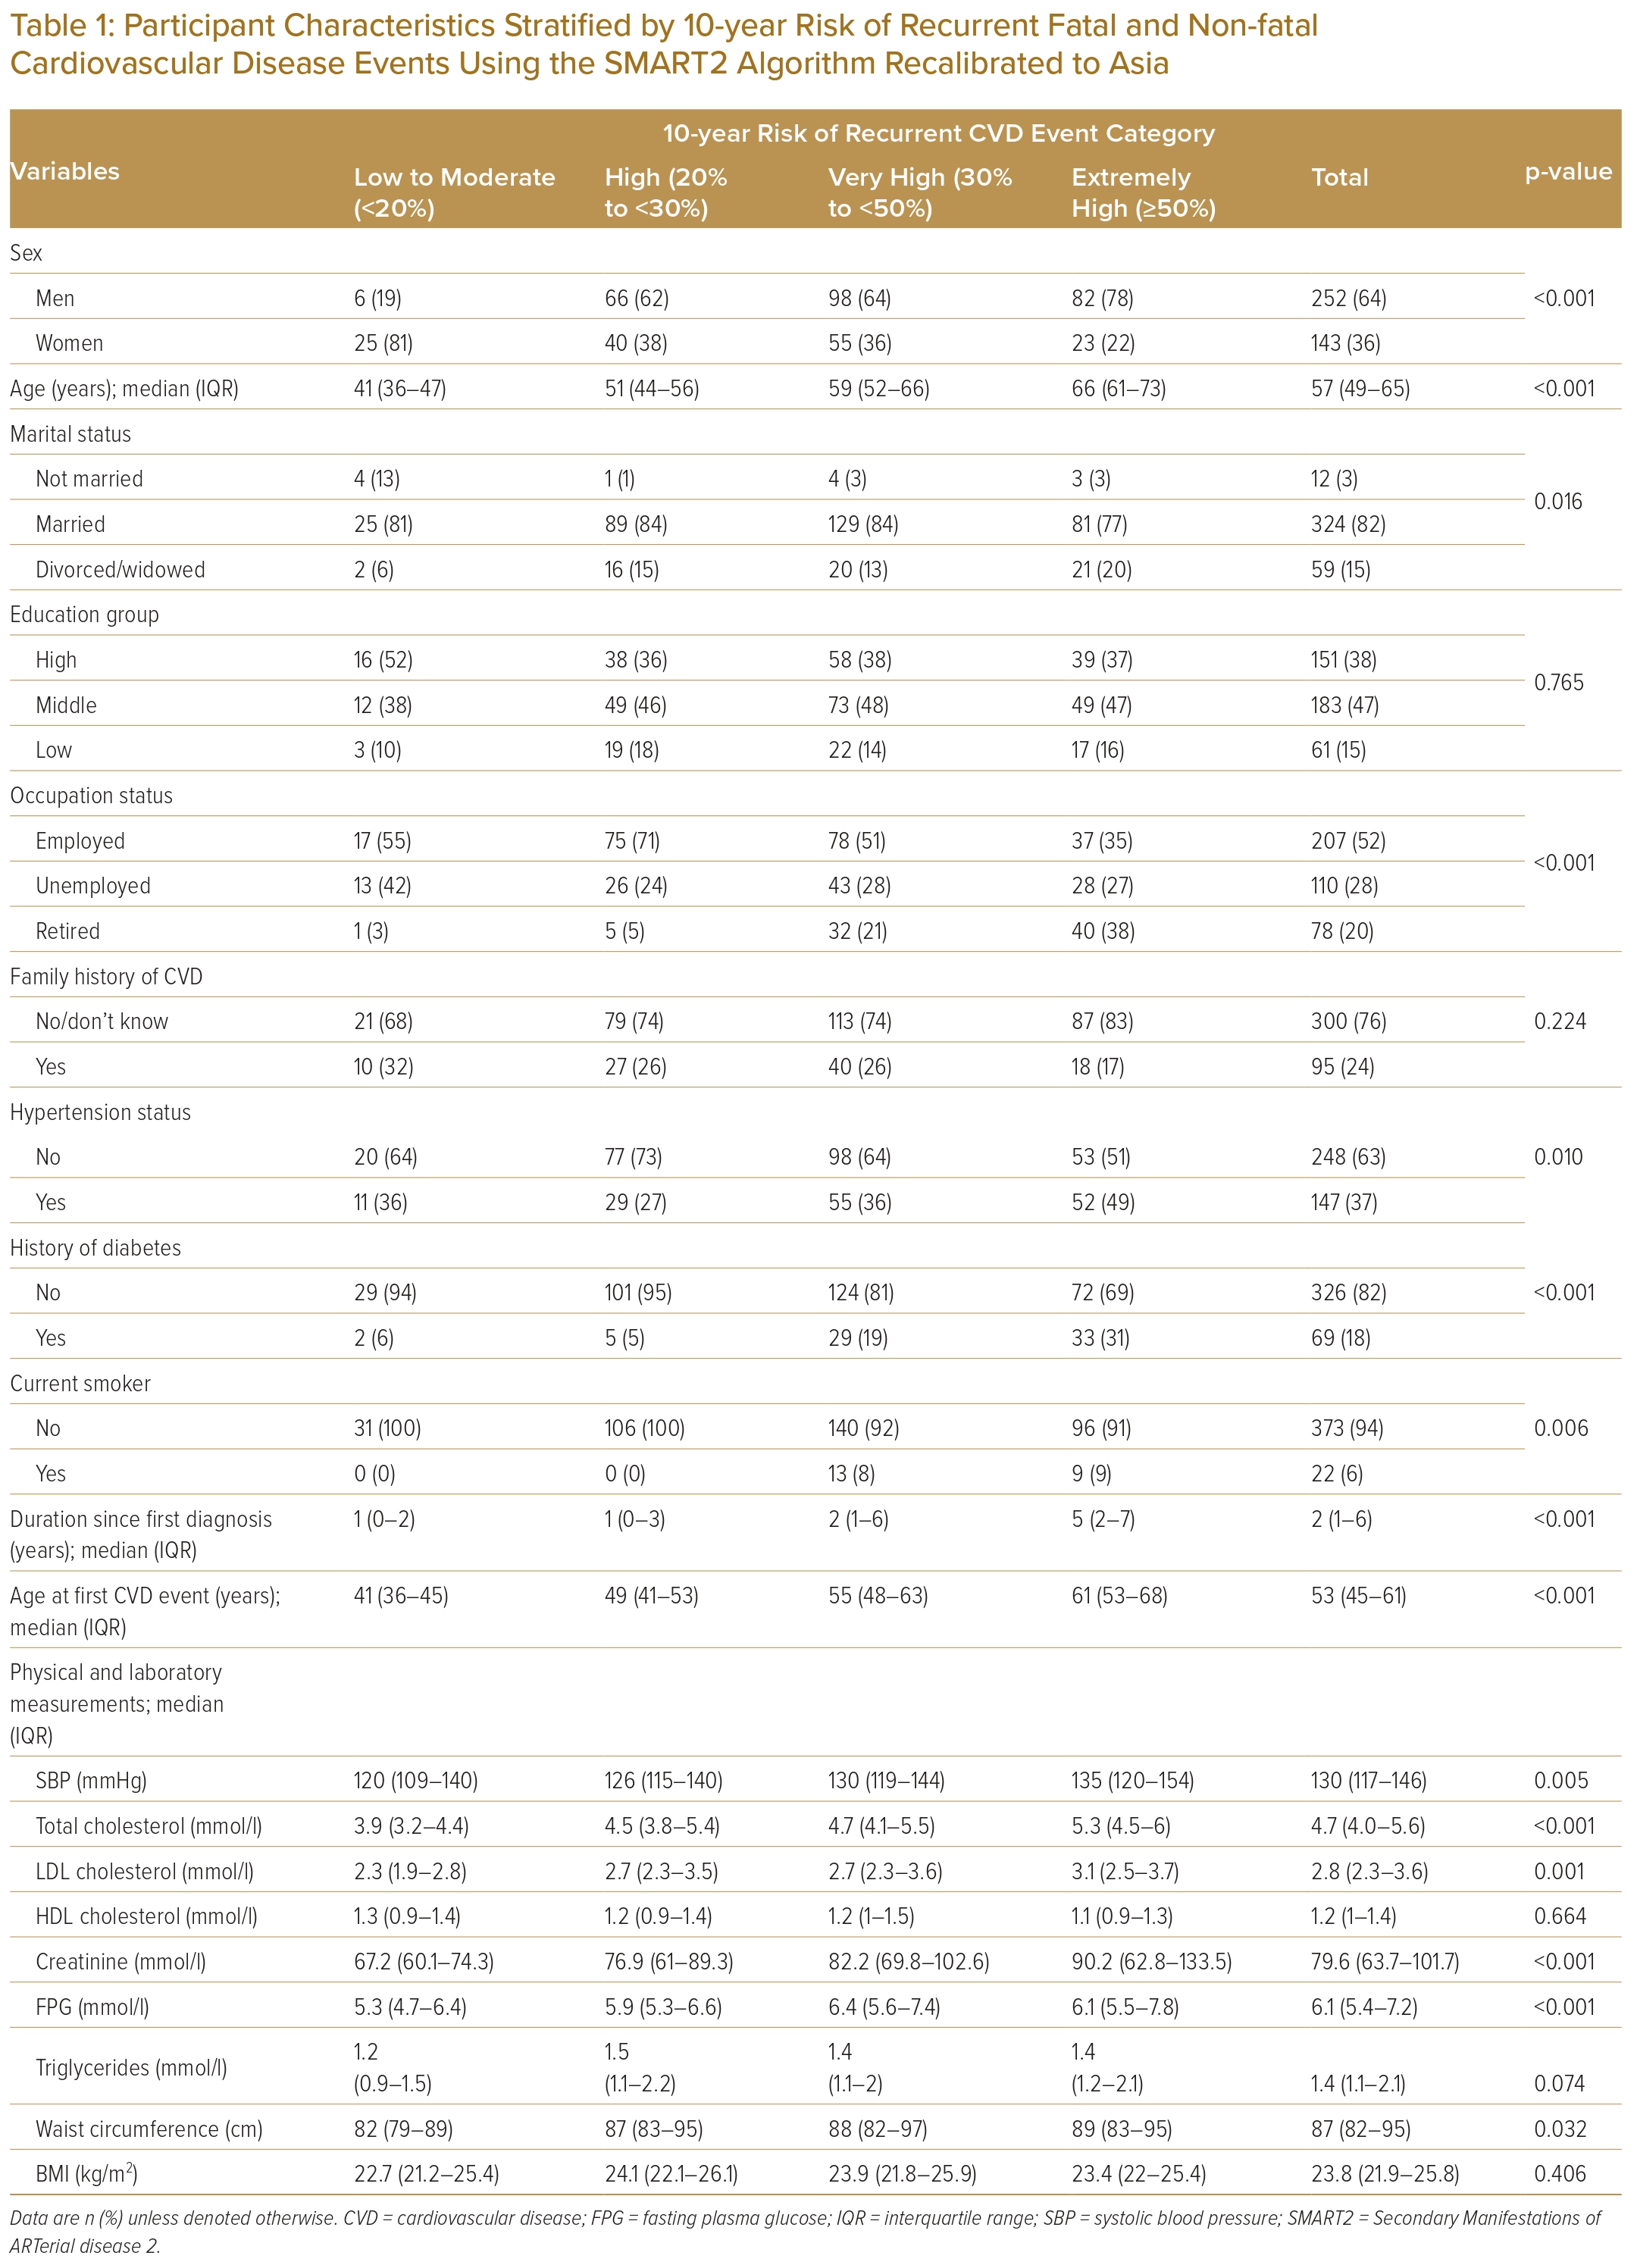
Table 1 describes the characteristics of the study participants. Data from 395 participants were included in the analysis. The mean age was 57 years (IQR 49–65) and the majority were men (64%); 37% had a history of hypertension, 18% had a history of diabetes and 6% were current smokers. A significantly different proportion of patients with hypertension (p=0.01), history of diabetes (p<0.001), smoking (p=0.006), duration since first CVD diagnosis (p<0.001), and age at first CVD event (p<0.001) was shown across risk categories. Mmedian SBP, total cholesterol and LDL cholesterol were 130 mmHg (IQR 117–146; p=0.005), 4.7 mmol/l (IQR 4.0–5.6; p<0.001), 2.8 mmol/l (IQR 2.3–3.6; p=0.001), respectively, and significantly different across 10-year risk of recurrent event risk group. In contrast, there were no significant risk score differences in HDL cholesterol (p=0.664) or BMI (p=0.406) across risk groups (Table 1).
Distribution of 10-year Risk of Recurrent Fatal and Non-fatal Cardiovascular Disease Events
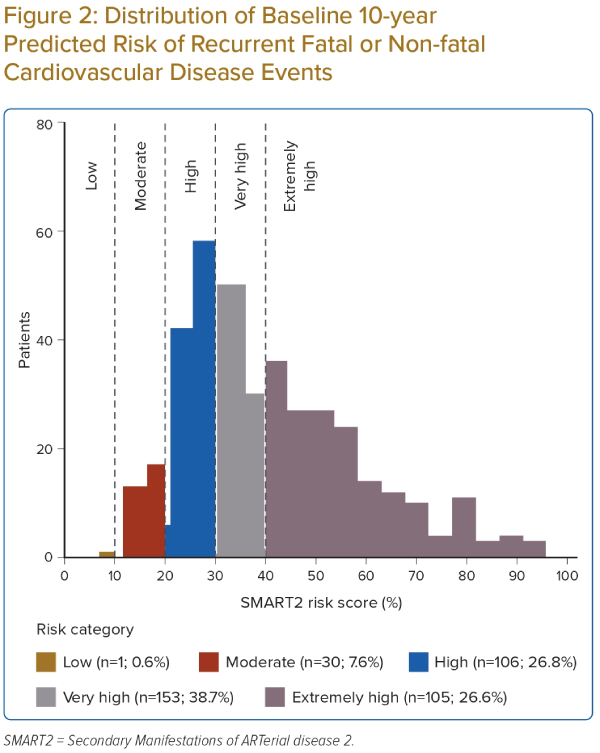
A wide distribution in the baseline 10-year risk of recurrent CVD events using the SMART2 risk score was observed. The 10-year predicted risks ranged from 6% to 95%, with a median score of 36% (Figure 2). In total, 38.7% of patients were considered as very high risk and 26.8% as extremely high risk for 10-year recurrent CVD events.
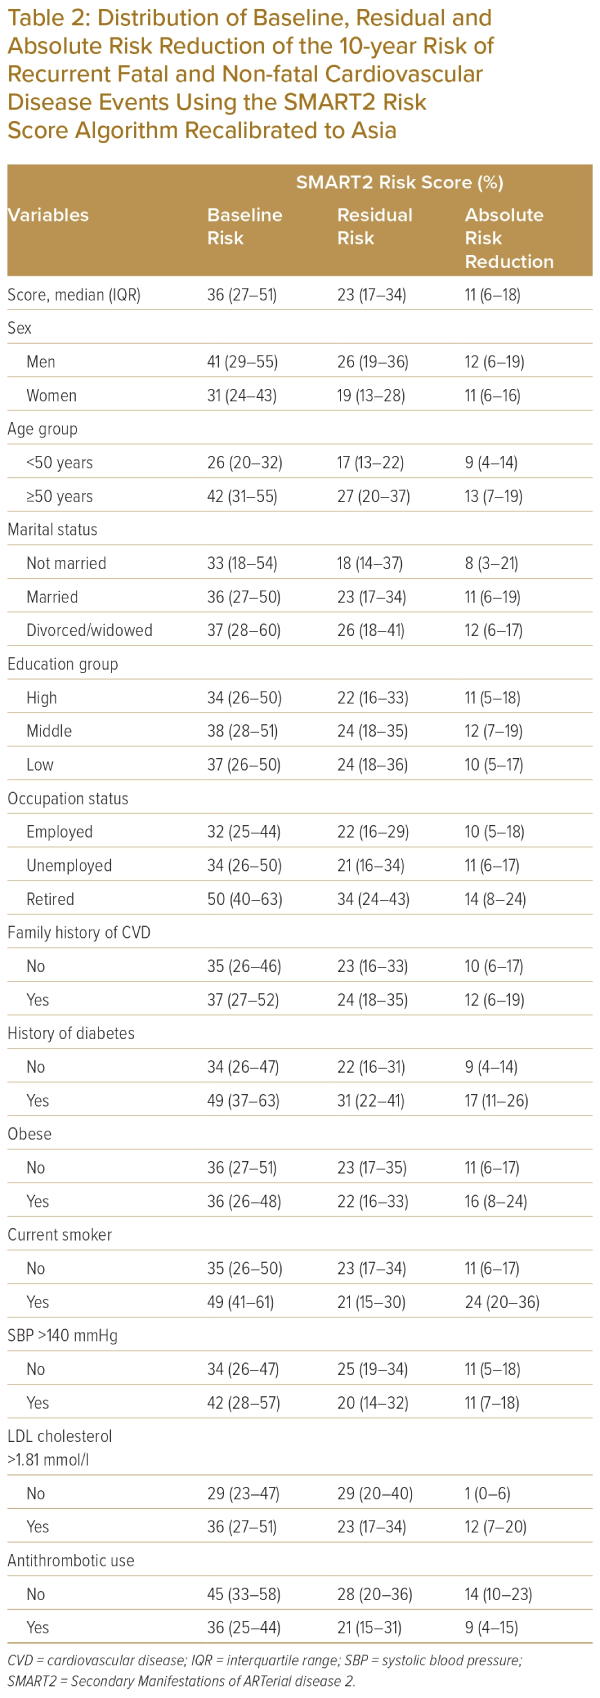
Higher baseline SMART2 risk scores were shown among males, older age groups (≥50 years), those who were divorced, had a lower education level, were retired or had family history of CVD, compared the other categories in the respective groups (Table 2).
Residual Risk and Absolute Risk Reduction Based on the SMART2 Risk Score Algorithm
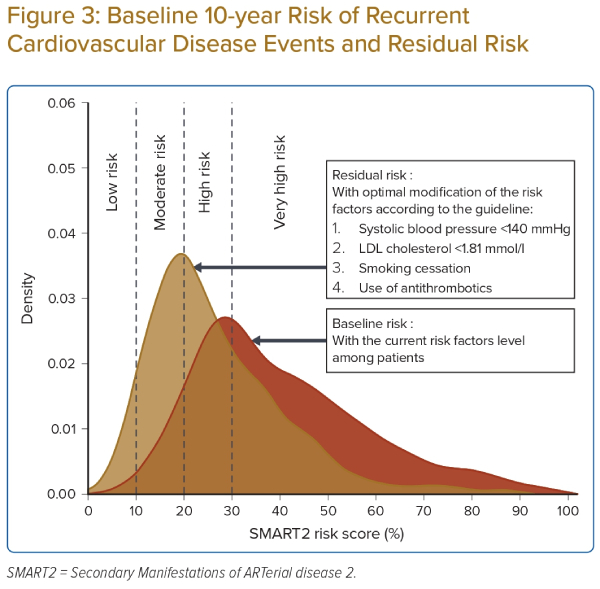
Table 2 and Figure 3 show a comparison between the baseline risk and the theoretical residual risk after meeting all guideline-recommended risk-factor targets (SBP <140 mmHg, LDL cholesterol <1.81 mmol/l, smoking cessation and the use of antithrombotic agents). The overall median residual SMART2 risk score was 23% (IQR 17−34).
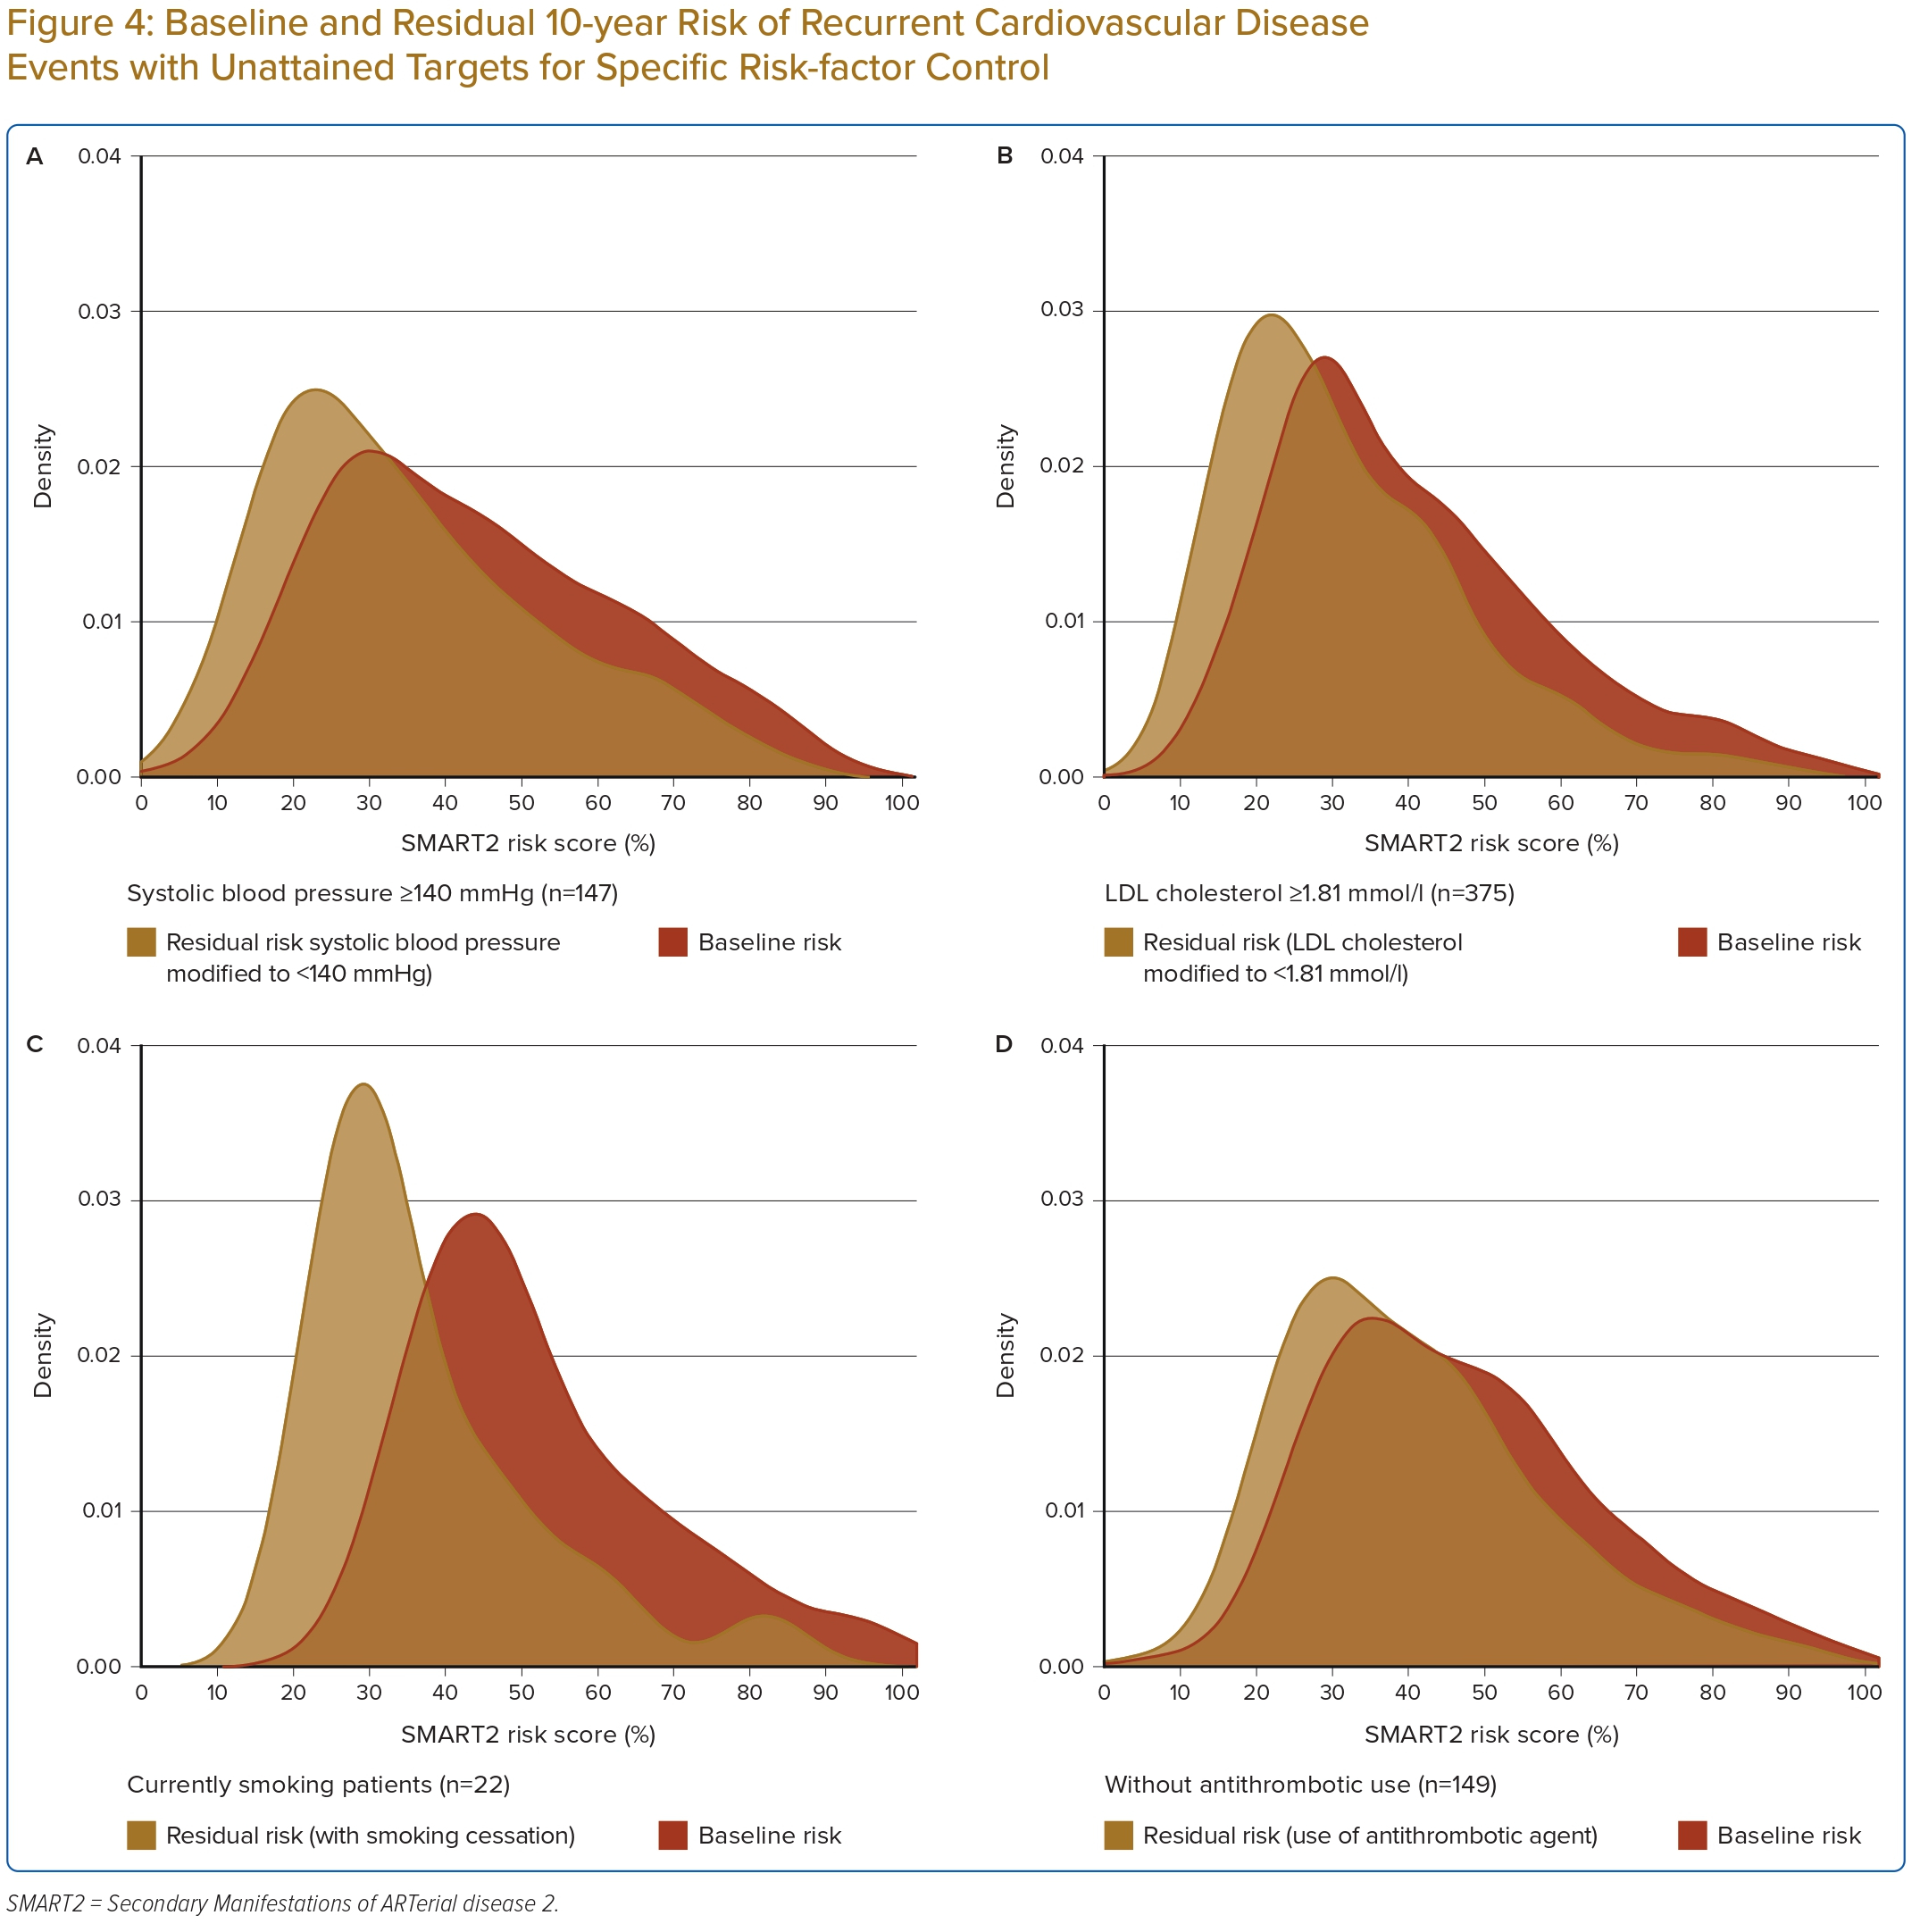
Figure 4 shows density curves comparing the baseline risk among CHD patients with certain uncontrolled risk factors: those with SBP >140 mmHg (n=147), LDL cholesterol >1.8 mmol/l (n=375), currently smoking (n=22) and current non-users of antithrombotic agents (n=149), along with the residual risk after optimal modification of their uncontrolled risk factors according to the guideline recommendations. Figure 4 shows that although significant reduction can be achieved among patients with uncontrolled risk factors, many of these patients still had a high residual risk.
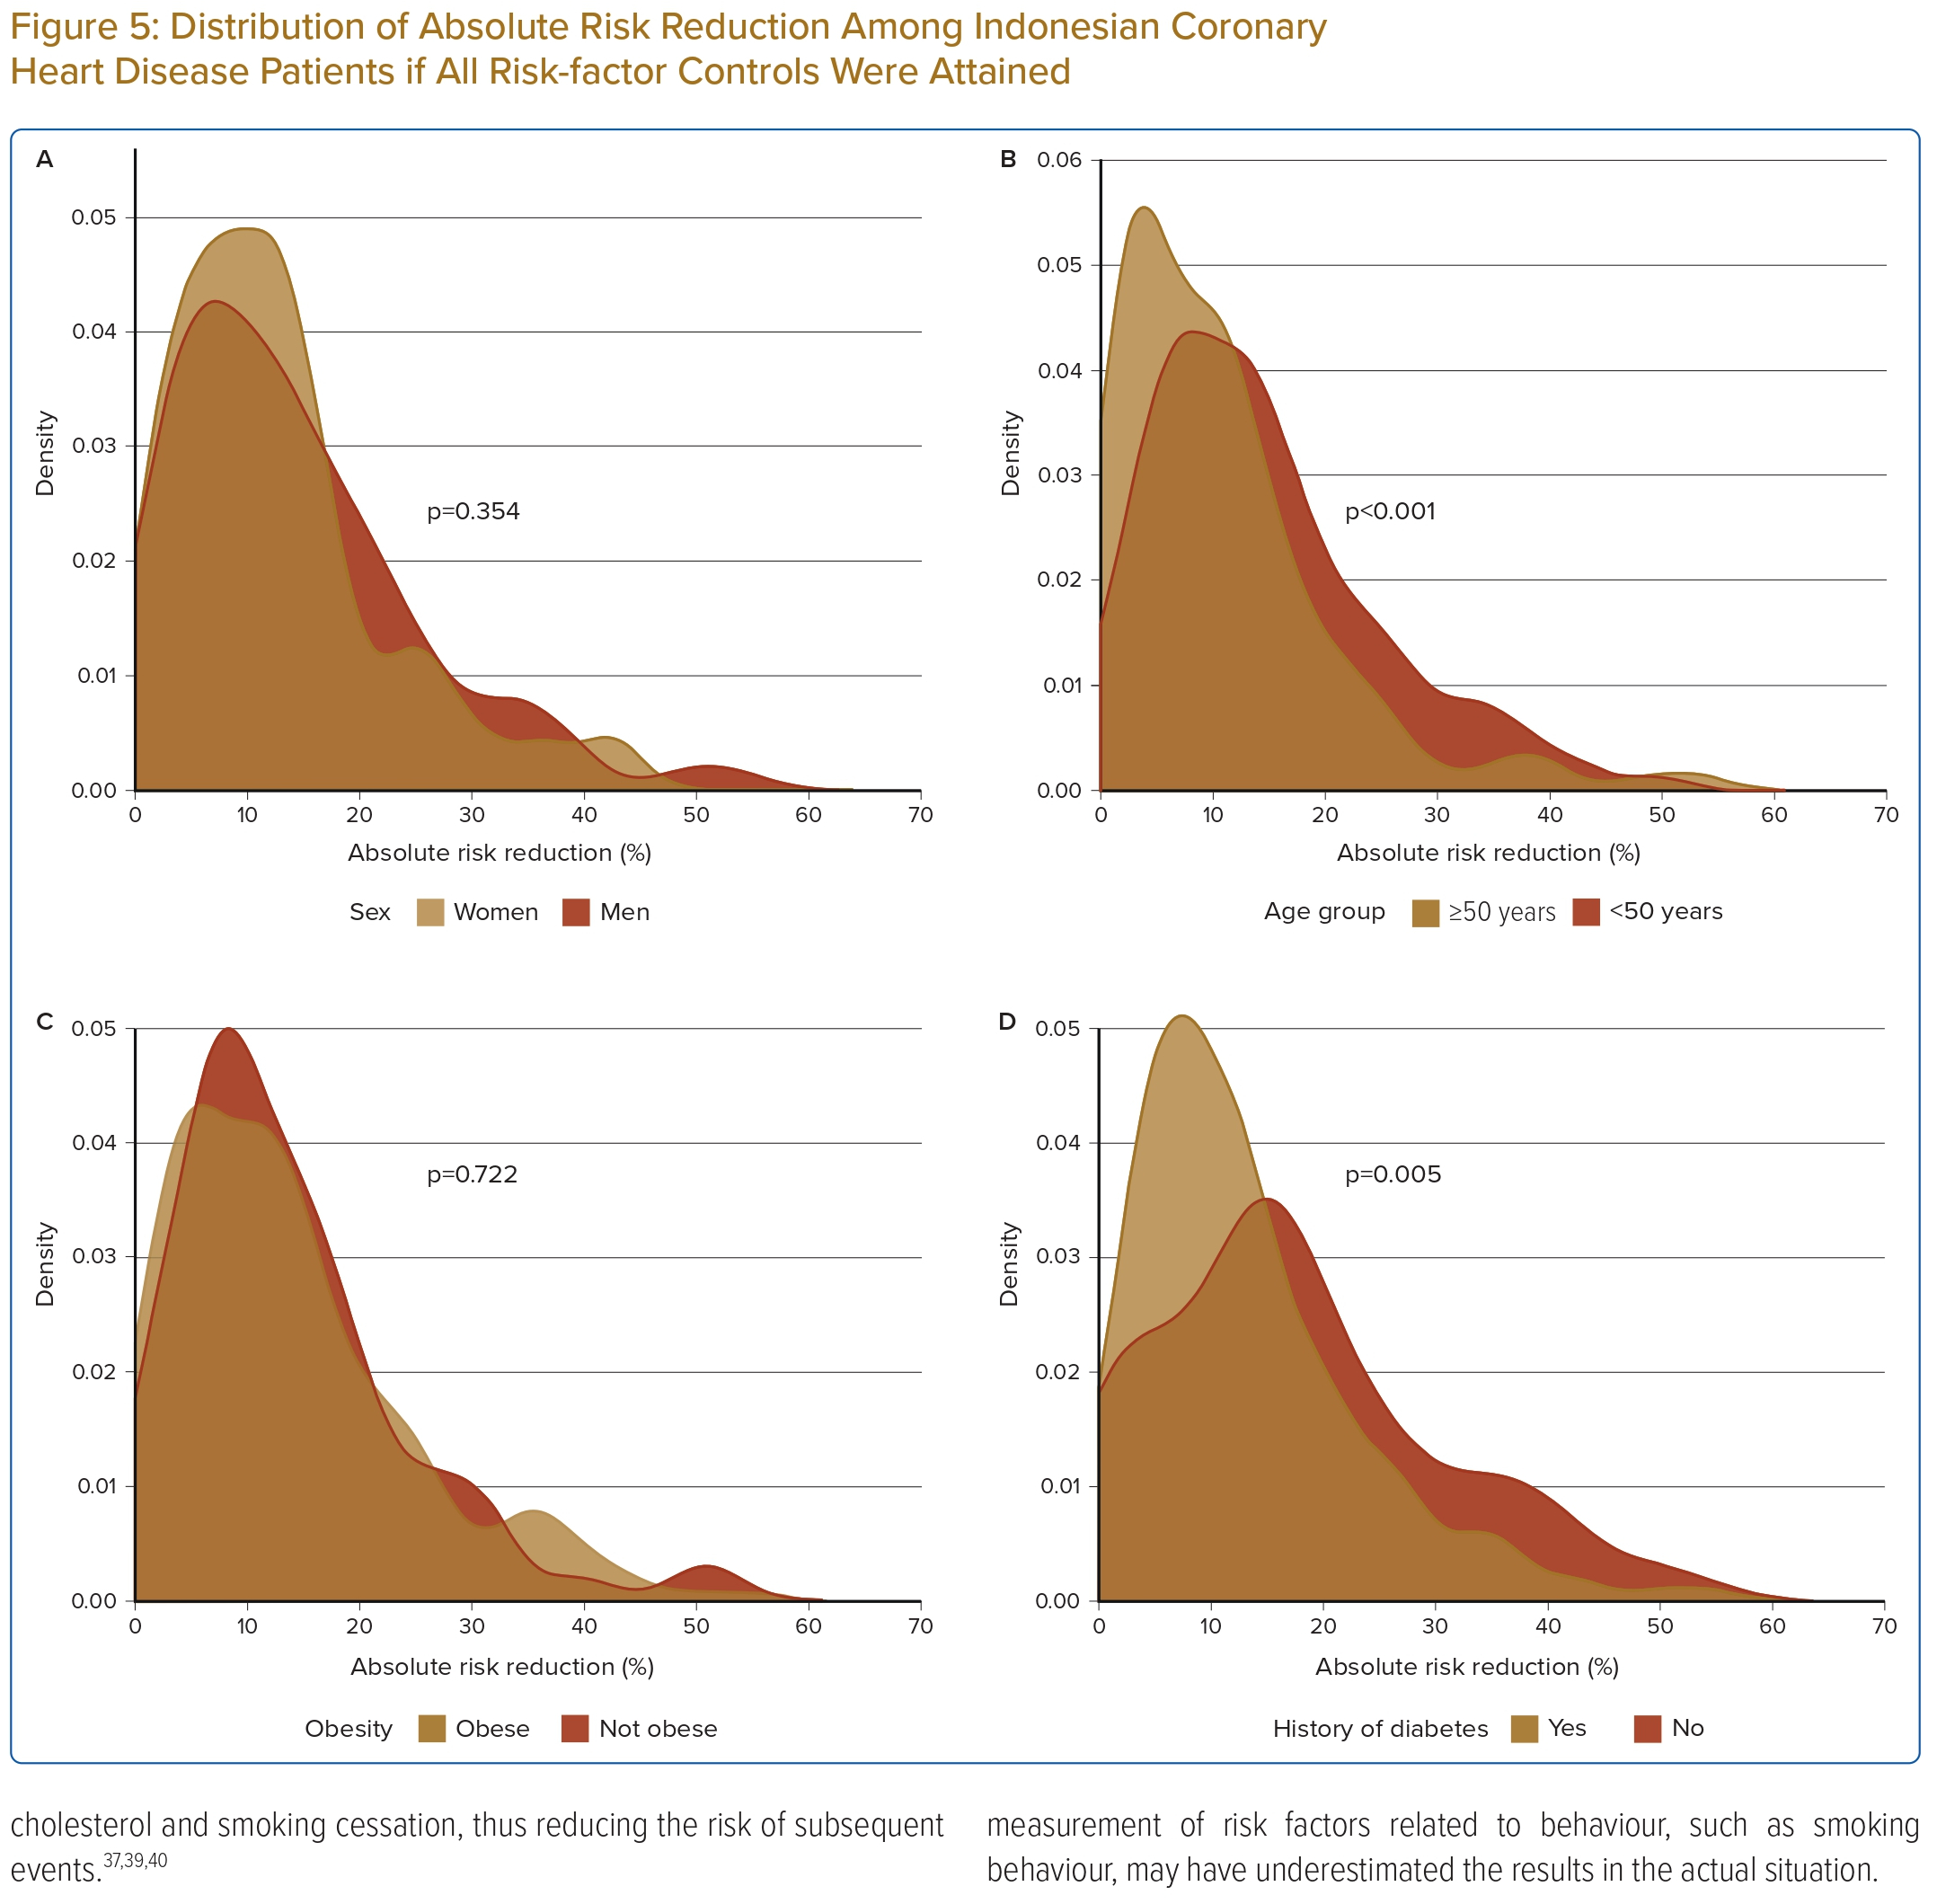
The overall ARR was 11% (IQR 6–18) among CHD patients. The distribution of ARR for 10-year risk of recurrent fatal and non-fatal CVD events ranged from 1% for patients who already met the LDL cholesterol recommendation level (<1.8 mmol/l) to 24% for currently smoking patients (Table 2). Furthermore, median ARR was different between age groups (≥50 versus <50 years; 13% versus 9%, p<0.001) and history of diabetes (yes versus no; 17% versus 9%, p<0.005) as shown in Figure 5. The overall NNT to prevent a single recurrent cardiovascular event in 10 years was eight patients, which was lowest among current smokers (NNT=4), those with both diabetes and CHD (NNT=6) and patients with obesity (NNT=6).
Discussion
This study applied the novel SMART2 risk score algorithm to Indonesian CHD patients to predict the 10-year risk for recurrent fatal or non-fatal CVD events. A large proportion of patients (65%) had a very high risk (≥30%) of subsequent fatal and non-fatal CVD events. Moreover, even after optimal modification of the risk factors to the recommended level according to the guideline, one-third of the patients would remain at very high risk for recurrent CVD events. However, significant risk reduction could be achieved among younger patients (<50 years) and those without diabetes.
The SMART2 Risk Score Algorithm
The use of risk prediction tools to assess the future risk of subsequent CVD events has become essential in the secondary-prevention population and is recommended in guidelines, in particular the 2021 ESC guidelines.8,9 The aim of using risk prediction tools is both to assist clinicians in appropriate decision-making and to provide patients with information regarding their level of risk, which may impact behaviour such as medication adherence and lifestyle changes.9,29 However, most established risk prediction tools are not adequately calibrated to the Asian population, including the Indonesian population.
An important advantage of the SMART2 risk score over its original version is that, at present, it is the only available algorithm for secondary prevention that has been recalibrated to Asian clinical practice: external validation was performed using data from several countries in Asia included in the REACH registry.15,30 The SMART2 risk score uses easy-to-measure parameters that are – most of the time – routinely collected in regular clinical practice, including in Indonesia. This provides an excellent opportunity for use as a tool to strengthen current national secondary-prevention programmes in regions where comprehensive laboratory tests may have more limited availability.
Nevertheless, while the use of risk prediction models such as SMART2 in addition to clinical judgement might improve the accuracy of risk stratification for patients, the general limitations of these models should be highlighted. Because of the nature of risk prediction algorithms, each model will have an uncertainty level and performance discrepancy if validated using different populations. Thus, external validation and recalibration in other specific target populations are necessary to improve risk-prediction performance.
Distribution of 10-Year Risk of Recurrent Fatal and Non-fatal Cardiovascular Disease Events
Despite the excess of a very high to extremely high predicted risk of recurrent CVD events, there was large variation in residual risk in the population evaluated, and a substantial proportion had low to moderate 10-year risks (<20%). The large differences in predicted residual risk indicate the need for a personalised approach given that those at higher risk will benefit more from intensified preventive treatment.
To our knowledge, there is no study has used the SMART2 risk score to estimate the recurrent CVD risk among the secondary-prevention population in the Asian region. A study in a European secondary-prevention population reported the validation of the SMART score and showed that the median risk was 17% (IQR 11%–28%).31 Similarly, a low 10-year risk of recurrent events was demonstrated in a study from Greece: the median risk score was 16.1%, which is significantly lower than our findings.32 The significant difference in CVD recurrent risk estimation in these studies compared with ours may be attributable to the difference in the incidence rate of CVD and its risk factors, whereby many Asian countries – including Indonesia – have a greater burden of risk factors such as hypertension, dyslipidaemia and diabetes among CVD patients.7,33
Residual Risk and Absolute Risk Reduction for Recurrent Cardiovascular Disease Events
With optimal risk-factor control according to the Indonesian secondary prevention guideline recommendations (SBP <140 mmHg, LDL cholesterol <1.81 mmol/l, smoking cessation and use of antithrombotics), a significant decrease in median SMART2 risk score was observed (36% in baseline versus 23% in residual risk).19 The highest risk reduction was observed especially among younger patients and those with no history of diabetes. In contrast to our findings, a study in patients with diabetes demonstrated a significant reduction of risk for recurrent CVD events.32
However, despite optimal risk-factor control and a significant decrease in the risk for subsequent CVD events, a notable number of patients remain at a high and very high-risk SMART2 score (>20% risk). This finding may suggest a potential need for stricter risk-factor control targets than the current guideline, especially in Indonesia where the incidence of CVD and its modifiable risk factors are high.7 A prior study has elucidated several factors associated with the high residual risk for recurrent major cardiovascular events among established CVD patients beyond the classical risk factors, such as inflammatory, pro-thrombotic and metabolic pathways.34 Moreover, modification and treatment of risk factors beyond lipid and blood pressure, such as socioeconomic factors, lifestyle and mental health, as well as environmental pollution, are also known to improve patients’ outcomes and contribute to a lower residual risk for recurrent CVD events, if they can be improved.
Implications for the Secondary Prevention of Cardiovascular Disease
According to their guidelines, the use of risk-assessment tools to assess the future risk for established CVD patients is standard procedure in many Western countries.9,35 In contrast, the use of risk prediction tools is limited in Asian countries, because of limited availability and access to the appropriate risk-prediction tools for the region.
The ability to differentiate high-risk vascular disease patients from those with a low risk for recurrent CVD events using risk prediction tools can be a potentially strong strategy to effectively use available resources, especially in low- and middle-income countries – including Indonesia – where evidence-based treatment for the secondary prevention of CVD is limited.36 In our study, the risk of recurrent events had a wide distribution. Some patients had a relatively low or moderate risk, and intensive medical treatment will have limited benefits in such patients. However, the high- to extremely high-risk groups – who will have the most benefit from the secondary prevention procedures – can be allocated to more intensified treatment options by healthcare facilities, especially in resource-limited settings. These findings illustrate that intensive preventive actions are required to reduce these extremely high risks, but that a single, one-size approach to secondary prevention is inappropriate because of the large variation in residual risks.
To date, only a limited number of studies have examined the impact of consecutive or routine risk assessments on clinical CVD events, such as CVD death and non-fatal CVD events.37,38 While these studies have shown limited evidence of the benefits of risk assessment in reducing clinical events, many suggest that providing risk assessment results improves the accuracy of risk perception, increases the intention to initiate prevention and treatment, promotes lifestyle changes and treatment adherence, and – ultimately – leads to lower risk factors such as blood pressure, cholesterol and smoking cessation, thus reducing the risk of subsequent events.37,39,40
Strengths and Limitations
The present study was performed in a representative sample of patients with established coronary artery disease in Indonesia. The residual risk after optimal treatment of the risk factors was calculated by combining estimates from the SMART2 risk score with causal evidence from meta-analyses.
However, the study has some limitations that should be considered. First is the relatively small sample size and that only patients with established CHD were included, while cerebrovascular disease, peripheral artery disease and other forms of vascular disease were not included. Inclusion of different manifestations of atherosclerotic patients would have further increased our knowledge on the burden of recurrent CVD in Indonesia. Second, as hs-CRP data were not available for the current study, the imputation of the median value from derivation data was conducted. However, previous research has shown that accurate predictions can be performed by imputation of the median value of hs-CRP from the derivation data, as was done in the current study.41 Finally, the self-reported measurement of risk factors related to behaviour, such as smoking behaviour, may have underestimated the results in the actual situation.
Conclusion
The present study revealed that a large proportion (65%) of Indonesian patients with established CHD had a very high risk of 10-year recurrent cardiovascular events. If all risk factors met the target recommendations according to the CVD secondary prevention guidelines, there would be a significant reduction in the subsequent risk in the future. However, even after risk-factor modification, approximately one-third of patients would remain at very high (>30%) 10-year risk of recurrent fatal and non-fatal CVD events. These findings have important clinical implications, as the large variation in 10-year CVD event risk illustrates that a single, one-size approach to secondary prevention is inappropriate and a personalised approach is necessary to identify patients who would benefit most from preventive treatment. The use of risk-assessment tools such as the SMART2 risk score can help to adapt personalised strategies to lower the residual risk in CHD patients and to identify patients who would benefit most from intensified treatment. This is crucial, particularly in regions where funds for secondary prevention agents are limited. 
Clinical Perspective
- This study revealed a wide range of estimated 10-year risk for recurrent fatal and non-fatal cardiovascular disease events, demonstrating that a single, one-sized approach for treating patients is no longer appropriate.
- The ability to identify individuals with very high residual risk with available risk-estimation tools may help clinicians to effectively allocate intensive treatments and follow-ups, especially in countries where secondary prevention agents are limited.
- Significant absolute risk reduction was shown in coronary artery disease patients with diabetes and younger age groups (<50 years), in whom adherence to secondary prevention to optimise risk factor treatment may yield the most benefit.
- Continuous communication of the estimated risk for recurrent fatal and non-fatal cardiovascular disease events to patients may help to improve therapy adherence and the attainment of risk-factor treatment goals.


